What you can verify in under a minute
The dashboard screenshots on this page show a beauty brand running across platform campaigns, GMV Max, affiliate contribution, and store-level growth dashboards at the same time. That gives you more than one isolated win to look at. You can verify how the account performed across acquisition, conversion, and creator-led revenue in the same proof set.
If you are screening operators, the practical value is simple: inspect the proof first, then compare it against the operating scope behind the result.
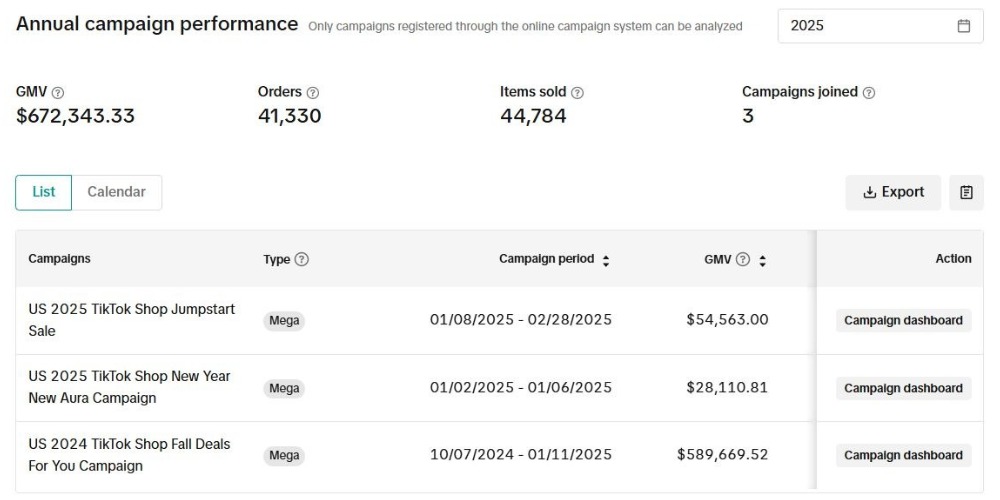
Annual campaign performance
The annual dashboard screenshot shows $672,343.33 GMV, 41,330 orders, 44,784 items sold, and 3 campaigns joined.
Key campaign rows
The screenshot also shows campaign GMV of $589,669.52 for the 2024 Fall Deals campaign, plus $54,563.00 and $28,110.81 for two 2025 campaign rows.
Paid efficiency with context
Two GMV Max views show 7.49-7.58 ROI on scaled spend, which is useful because the paid screenshots sit alongside listing, creator, and store-level proof.
Affiliate revenue is visible
The affiliate dashboard shows a top creator row at $130.11K affiliate GMV, with multiple supporting contributors behind it instead of one thin screenshot.
What beauty brands can verify from this proof set
This result is commercially useful because it shows how multiple revenue layers can work together in the same account. For beauty brands, that usually means paid performance is not carrying the whole channel alone, creators are contributing meaningful GMV, and the shop is converting well enough for scale to hold.
Conversion quality matters before scale
Strong ROI and buyer growth usually point back to the same operating basics: clear listings, a strong offer, and a store that can convert traffic once creators and paid campaigns start working. Avanta's listing optimization service explains that conversion layer in more detail.
Creator and paid should reinforce each other
The affiliate rows and GMV Max screenshots show a healthier channel mix than a brand that relies on one tactic. If you want the beauty-category version of that operating model, review the beauty brand service page and the creator affiliate growth service.
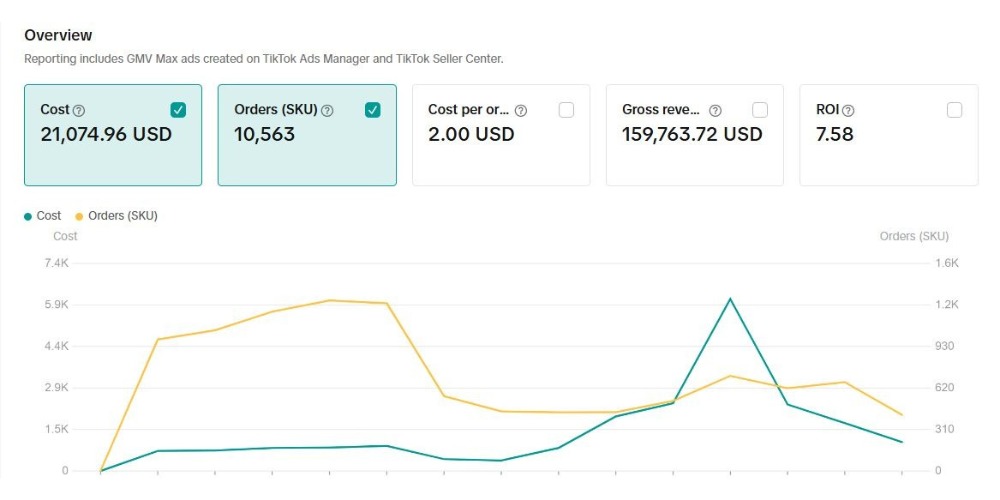
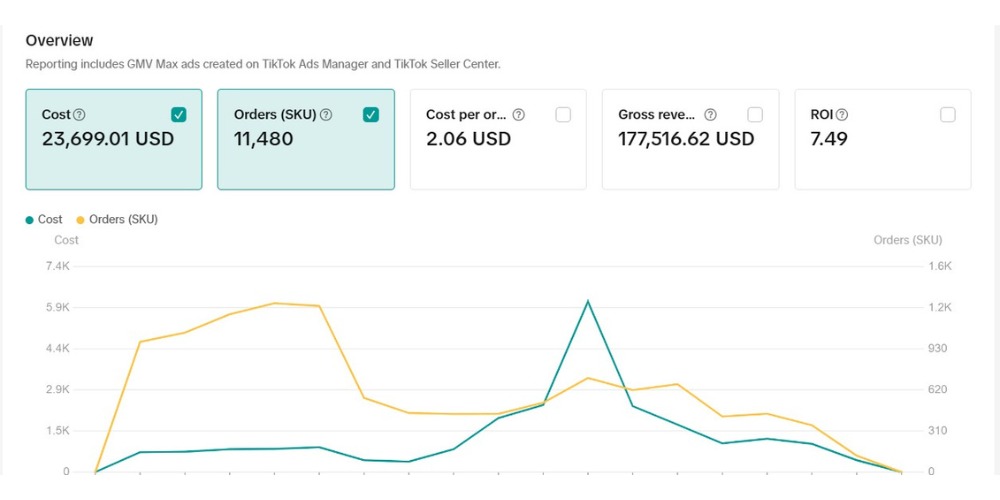
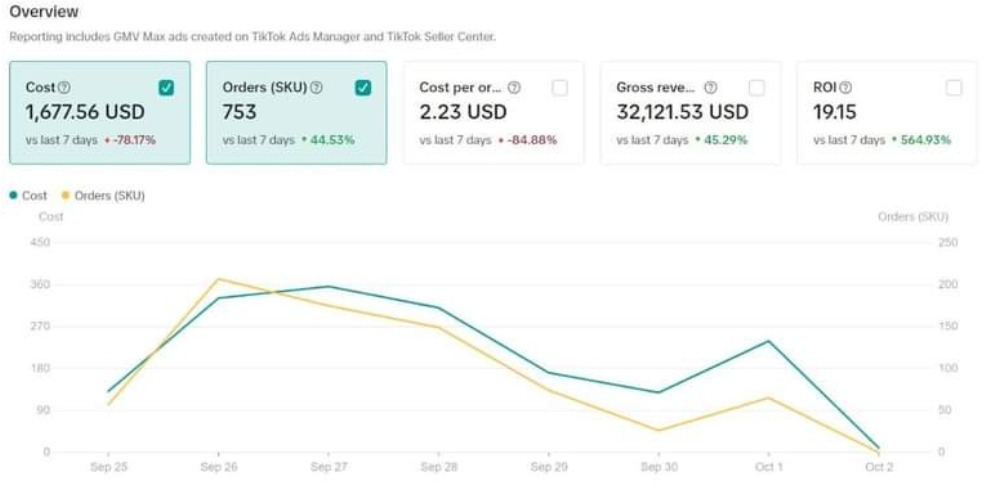
GMV Max and paid efficiency
Two GMV Max screenshots show paid performance in useful detail. One view shows $21,074.96 cost, 10,563 orders, $159,763.72 gross revenue, and 7.58 ROI. Another shows $23,699.01 cost, 11,480 orders, $177,516.62 gross revenue, and 7.49 ROI.
There is also a shorter-period dashboard showing $1,677.56 spend, 753 orders, $32,121.53 gross revenue, and 19.15 ROI. Together, the screenshots show performance across both scaled periods and shorter bursts instead of relying on one isolated view.
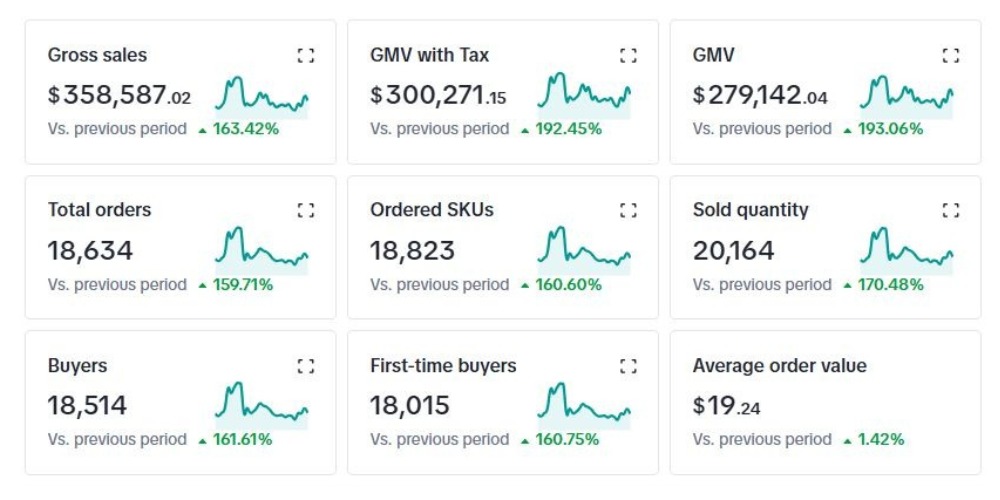
Store growth and buyer expansion
The store-growth panel shows $358,587.02 gross sales, $300,271.15 GMV with tax, $279,142.04 GMV, 18,634 total orders, 18,514 buyers, and 18,015 first-time buyers in the same window. It captures both revenue and customer expansion, with strong order volume and first-time buyer growth.
The same panel shows a $19.24 average order value, which adds useful context to how the account was converting at that point.
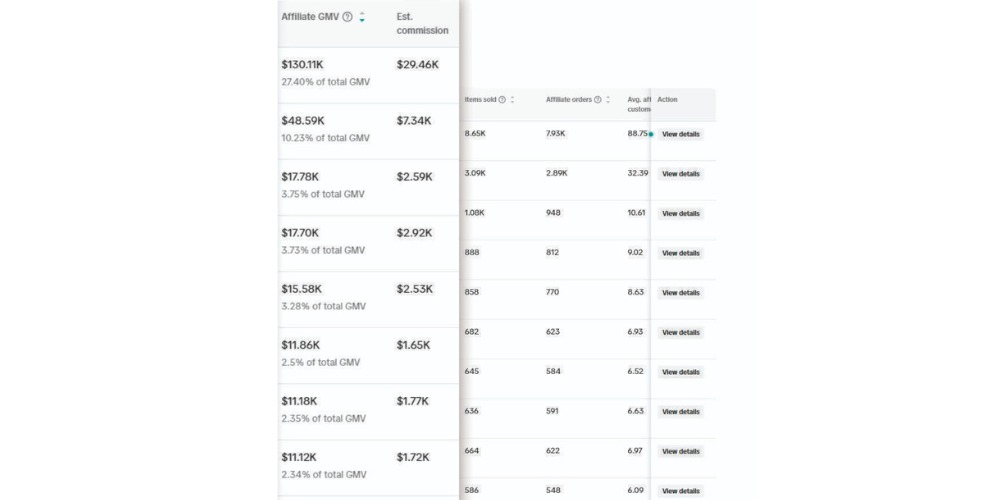
Affiliate contribution matters
The affiliate screenshot is useful because it shows real contribution from creators rather than treating affiliate as a buzzword. The top row shows $130.11K affiliate GMV, representing 27.40% of total GMV, with an estimated commission of $29.46K. Additional rows show sizeable contribution bands at $48.59K, $17.78K, $17.70K, and $15.58K. For brands trying to build that same layer intentionally, Avanta's creator affiliate growth service explains the operating system behind the output.
That is what creator contribution looks like when affiliate operations are managed as a revenue channel instead of treated as a side tactic.
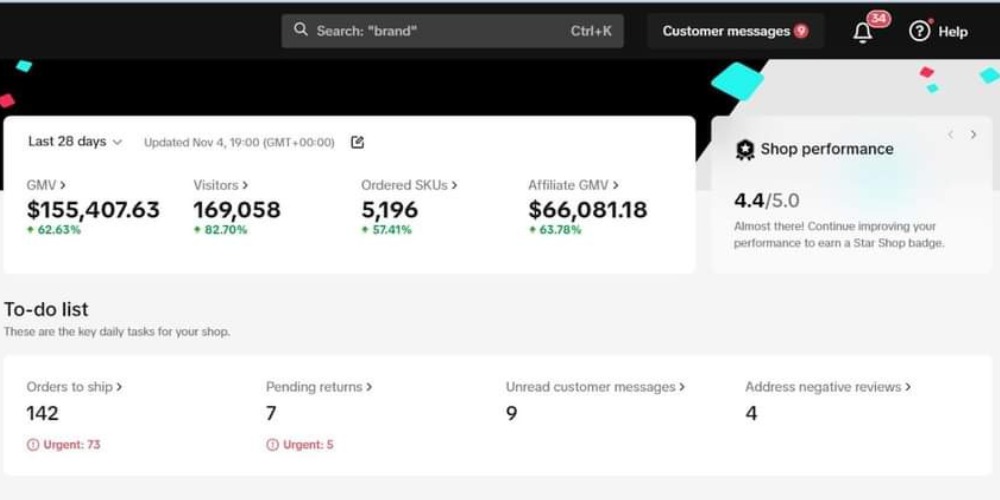
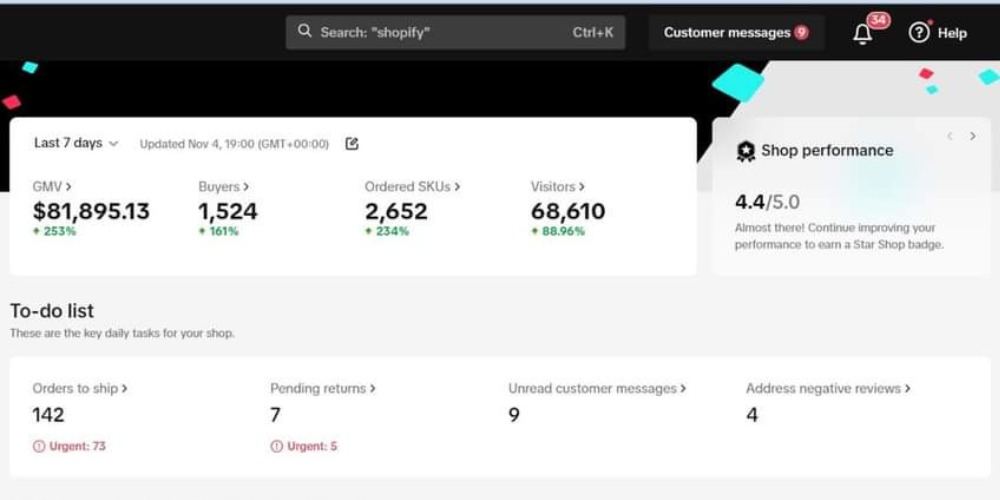
Recent dashboard momentum
The screenshot set also shows two recent performance windows. One 28-day dashboard shows $155,407.63 GMV, 169,058 visitors, 5,196 ordered SKUs, and $66,081.18 affiliate GMV. Another 7-day dashboard shows $81,895.13 GMV, 1,524 buyers, 2,652 ordered SKUs, and 68,610 visitors.
Combined, these views show annual trend, campaign-level GMV, paid efficiency, affiliate contribution, and recent operating momentum in one account. Brands that want the beauty-category version of that operating model can also review Avanta's beauty brand service page.
Why this matters if you are evaluating a TikTok Shop agency
Most brands do not need more generic promises. They need evidence that the team can manage the layers that actually move revenue: creator recruitment, listing quality, paid efficiency, reporting discipline, and weekly operating cadence. This case study is useful because those layers show up in the numbers instead of being left abstract.
For brands that want to qualify fit quickly, the most relevant next step after this page is to compare the proof here with Avanta's service scope, category fit, and pricing pages before booking time.
Paid can scale when the shop converts
The GMV Max screenshots point to strong paid efficiency, but that only happens when the product page, offer, and creative system hold up. For that operating layer, see Avanta's listing optimization service.
Affiliate contribution is a managed revenue channel
The creator rows matter because they show affiliate as real GMV, not just outreach activity. The service page on creator affiliate growth explains how that system is managed week to week.
If you want the broader operating scope behind this proof set, compare this page with Avanta's TikTok Shop management service, the beauty brand TikTok Shop service page, and the TikTok Shop agency pricing guide. Together they make it easier to judge fit, scope, and accountability before a call.
Questions brands usually ask after seeing this proof
How much GMV is shown here?
The annual performance dashboard shows $672,343.33 GMV, 41,330 orders, and 44,784 items sold across three campaign rows.
Was paid performance efficient?
Yes. The GMV Max screenshots show 7.49-7.58 ROI across two scaled paid windows, plus a shorter period at 19.15 ROI on lighter spend.
Did creators materially contribute?
Yes. The affiliate dashboard shows a top creator row at $130.11K affiliate GMV, with several additional rows contributing meaningful volume behind it.
What does Avanta actually manage?
This result points to one connected system across creators, listings, platform campaigns, GMV Max, and account management. For the operating scope, review the management service page.