Skincare Brand 90-Day Growth
Shows how better creator systems and cleaner listing work helped improve early momentum on TikTok Shop.
Review proof from Avanta Brands across beauty, skincare, supplements, and CPG brand operators. These pages show real GMV, ROI, affiliate contribution, and store-growth snapshots so teams comparing a TikTok Shop agency can evaluate the work against visible evidence.
This brand came in with strong product-market fit and zero TikTok Shop infrastructure. Within the first 90 days, we built out their creator program, optimized their listings, and established a content cadence that held. Here is what that looked like in numbers.
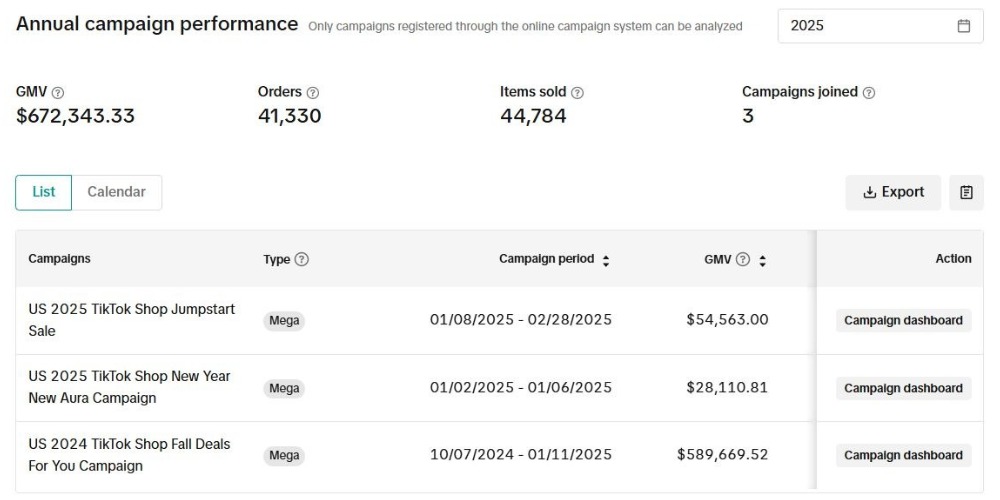
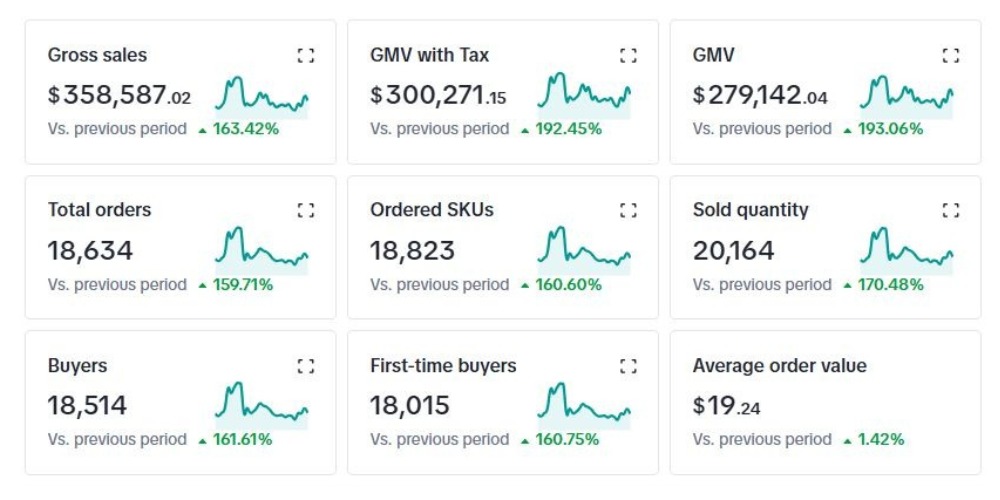
The screenshots show the account from multiple angles - campaign performance, paid efficiency, affiliate contribution, and store growth - instead of relying on one isolated metric.
Newer clients move faster than they expect to. These are snapshots from recent accounts - early traction, channel setup, and the first signs of what the system produces when it is running correctly.
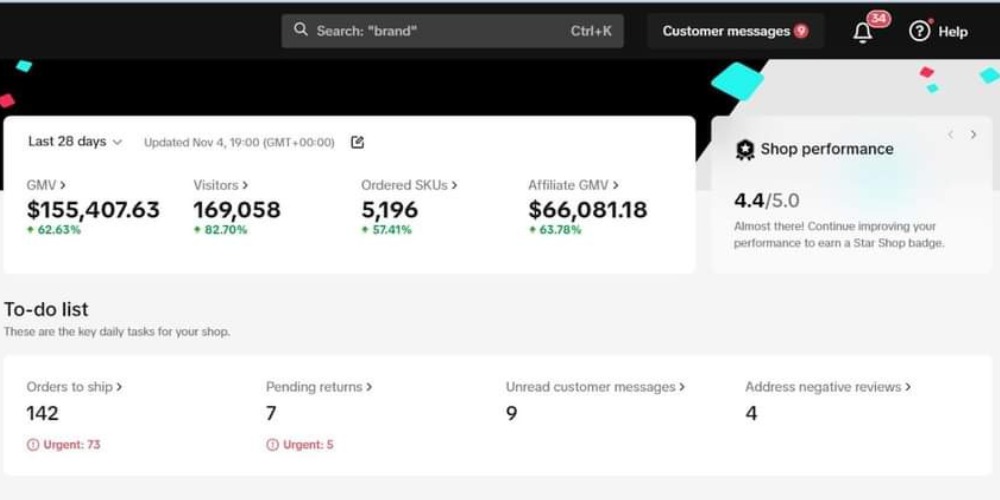
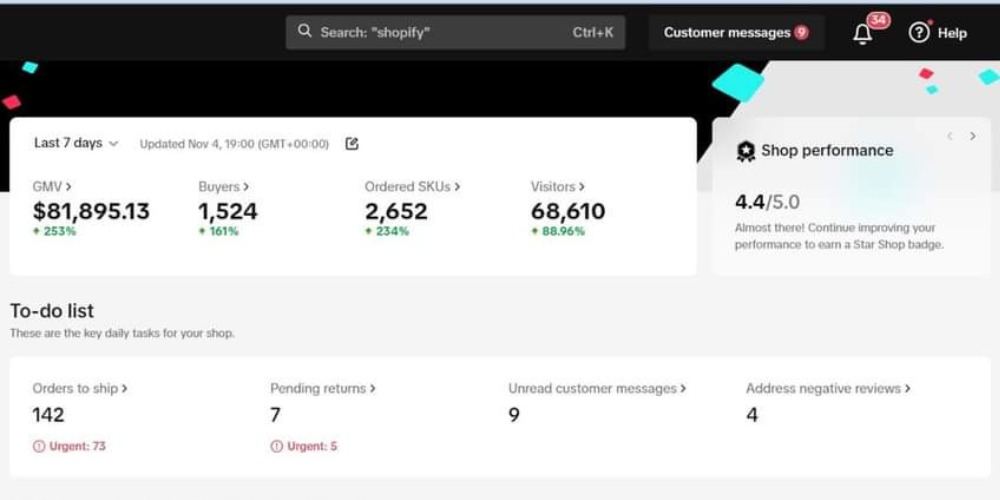
These shorter windows make it easier to see recent momentum, not just the largest headline number in the account history.
Across beauty, wellness, supplements, and Amazon-native brands making the move to TikTok Shop - these are the engagements that shaped how we operate today.
Shows how better creator systems and cleaner listing work helped improve early momentum on TikTok Shop.
Shows how affiliate operations and better creator follow-through can translate into more usable content volume and stronger channel motion.
Some brands need a full operating partner. Others need clarity on creator systems, listing conversion work, or how TikTok Shop can scale once the early signal appears. These paths make that easier to evaluate.
Best for brands comparing agencies or management partners and wanting to see GMV, store growth, affiliate contribution, and paid efficiency together.
Best for teams trying to understand what creator systems, offer cleanup, and listing fixes can change during the first serious operating sprint.
Best for brands getting creator replies but not enough posted content, usable assets, or consistent follow-through from affiliate outreach.
If you are evaluating operators, compare what the proof pages show against how an agency explains ownership, reporting, creator systems, and paid amplification.